
One of our key service offerings is using statistical analysis and text analytics together with our proprietary database of procurement key words to determine what an organization is buying and how.
This article focuses on one use case of procurement analytics — is there enough evidence for you to consider alternative ways of sourcing some of the products that you buy?
Procurement analytics (using statistical and text analytics) creates a foundation that can help in making several key procurement decisions, on the basis of data that would not otherwise have been available.
Indirect purchases (MRO) are often done using p-cards, employee expenses or purchase requisitions. The free-form descriptions of the purchased items make it nearly impossible for the organization to understand what is being purchased and how much. Purchase categories used are normally misclassified and are rarely granular enough to enable meaningful analysis. The lack of the ability to measure makes it difficult to optimize the procurement process or to detect misuse.
Let us take the case of one specific client. We looked at procurement across various channels (requisitions, p-cards, employee expenses, etc.), examined all of their indirect purchases and used common semantics to classify them. For example, printer ink, toner and cartridge were all classified as “Printer Cartridges”; Printer, All-in-One, LaserJet and OfficeJets were all classified as Printers.
Let us focus on the procurement of laptops at this client, as it is a representative case. Employees used various channels — requisitions, p-cards, employee expenses — to purchase laptops, and the descriptions of the item differed widely. Some common, often long-winded, descriptions included words like “notebook”, “dell latitude”, “laptop”, “pc”, “mac book”, “HP spectre” and even model numbers. Our analytics process classified all of these as laptops. There were also several purchases for laptop accessories (bags, power cords) whose descriptions contained the same key words; our process, using text and statistical analytics, correctly classified them into a different category.
The visuals below show some of our observations.
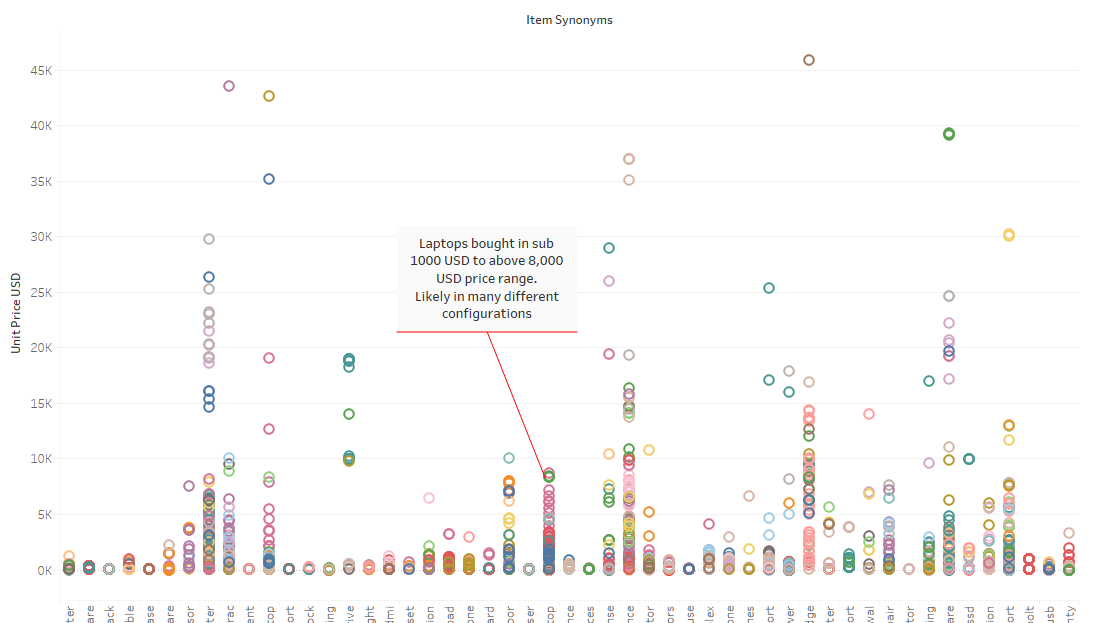
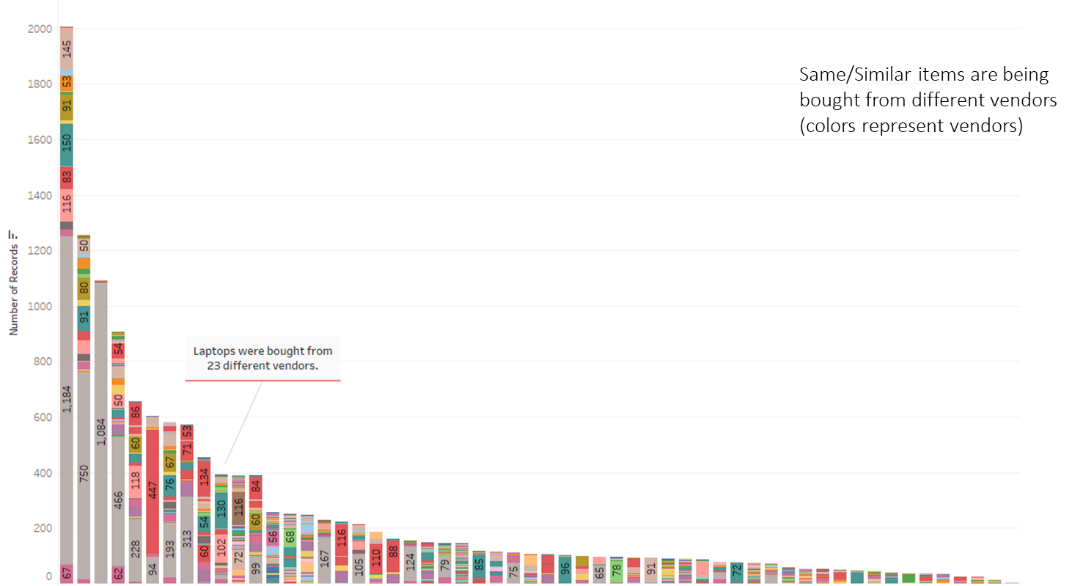
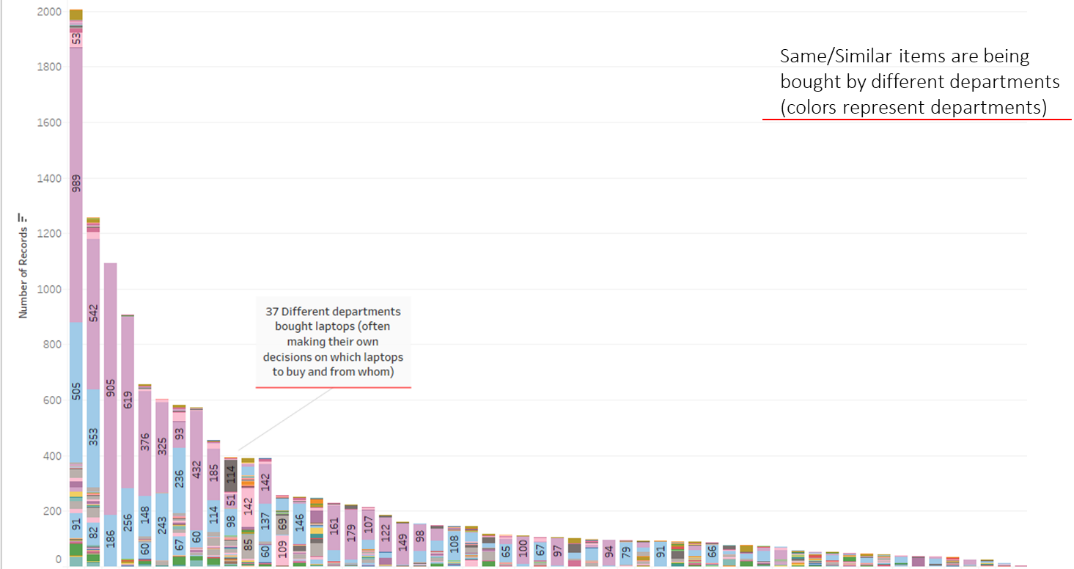
Laptops were being purchased from various vendors, with various configurations, for a wide range of prices. There was a clear opportunity for price savings. Many departments and individuals were independently making laptop buying decisions, perhaps spending a lot of time researching the best laptop to buy. Despite BYOD, technical support would have to support various brands and configurations.
Centralized sourcing was suggested and implemented, and three vendors were identified across geographies. Configurations were limited and prices were negotiated. The impact was almost immediate.
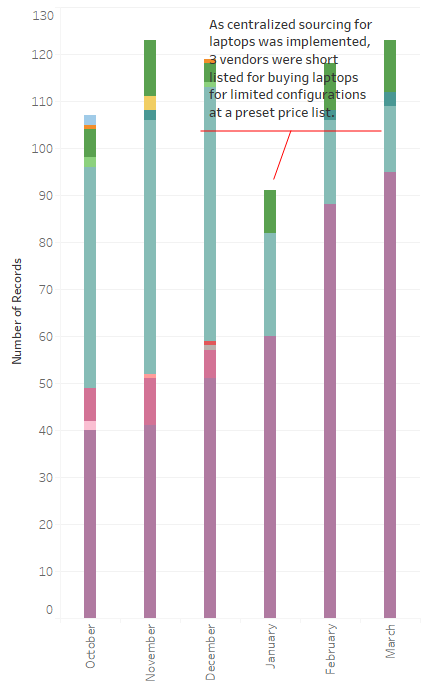
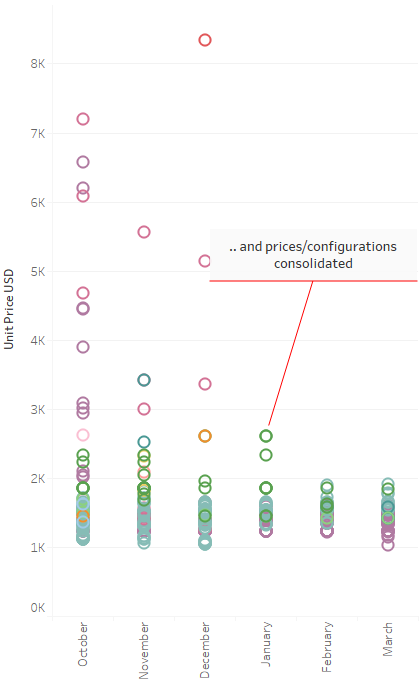
Motivation to centralize procurement might not just be price consolidation — it could be to prevent misuse, or for other soft savings and employee time.
While it is common for organizations to quickly reach the obvious decision to centralize sourcing of laptops, we have made similar data-backed recommendations for various other purchases. Some of the most common are office supplies, printers, printer cartridges, phones and tablets.
Some other examples of how the procurement analytics output has been used by our clients:
Want to have an introductory discussion with our experts? We will be happy to have a call with you. Don’t worry, it is free!
Or want to test us out for a week at a heavily discounted price? Engage us — you won’t regret it!
Just leave us your details and we will contact you within 12 hours. We know your problem is urgent!
Or call us at 510 278 4083
email us at contact@neocortex.com